Research Results:RQ1_2021
Early detection of spread of infection
Related reports

Researcher
Taisuke Nakata

Researcher
Masashi Toyoda

Infection Simulation based on Proposed Human Behavior Models derived from SNS and Press Data #32
2022.03.08
Organization
Faculty of Science and Technology, Keio University
Researcher
Satoshi Kurihara

Researcher
Masashi Toyoda

Researcher
Masashi Toyoda

Infection Simulation based on Proposed Human Behavior Models derived from SNS and Press Data #31
2022.03.01
Organization
Faculty of Science and Technology, Keio University
Researcher
Satoshi Kurihara

Researcher
Masashi Toyoda

Infection Simulation based on Proposed Human Behavior Models derived from SNS and Press Data #30
2022.02.22
Organization
Faculty of Science and Technology, Keio University
Researcher
Satoshi Kurihara

Researcher
Masashi Toyoda

Infection Simulation based on Proposed Human Behavior Models derived from SNS and Press Data #29
2022.02.15
Organization
Faculty of Science and Technology, Keio University
Researcher
Satoshi Kurihara

Researcher
Masashi Toyoda

Infection Simulation based on Proposed Human Behavior Models derived from SNS and Press Data #28
2022.02.08
Organization
Faculty of Science and Technology, Keio University
Researcher
Satoshi Kurihara

Infection Simulation based on Proposed Human Behavior Models derived from SNS and Press Data #27
2022.02.01
Organization
Faculty of Science and Technology, Keio University
Researcher
Satoshi Kurihara

Researcher
Masashi Toyoda

Infection Simulation based on Proposed Human Behavior Models derived from SNS and Press Data #26
2022.01.25
Organization
Faculty of Science and Technology, Keio University
Researcher
Satoshi Kurihara

Researcher
Masashi Toyoda

Researcher
Masashi Toyoda

Infection Simulation based on Proposed Human Behavior Models derived from SNS and Press Data #25
2022.01.18
Organization
Faculty of Science and Technology, Keio University
Researcher
Satoshi Kurihara
Infection Simulation based on Proposed Human Behavior Models derived from SNS and Press Data #24
2022.01.11
Organization
Faculty of Science and Technology, Keio University
Researcher
Satoshi Kurihara

Researcher
Masashi Toyoda

Researcher
Masashi Toyoda

Researcher
Masashi Toyoda

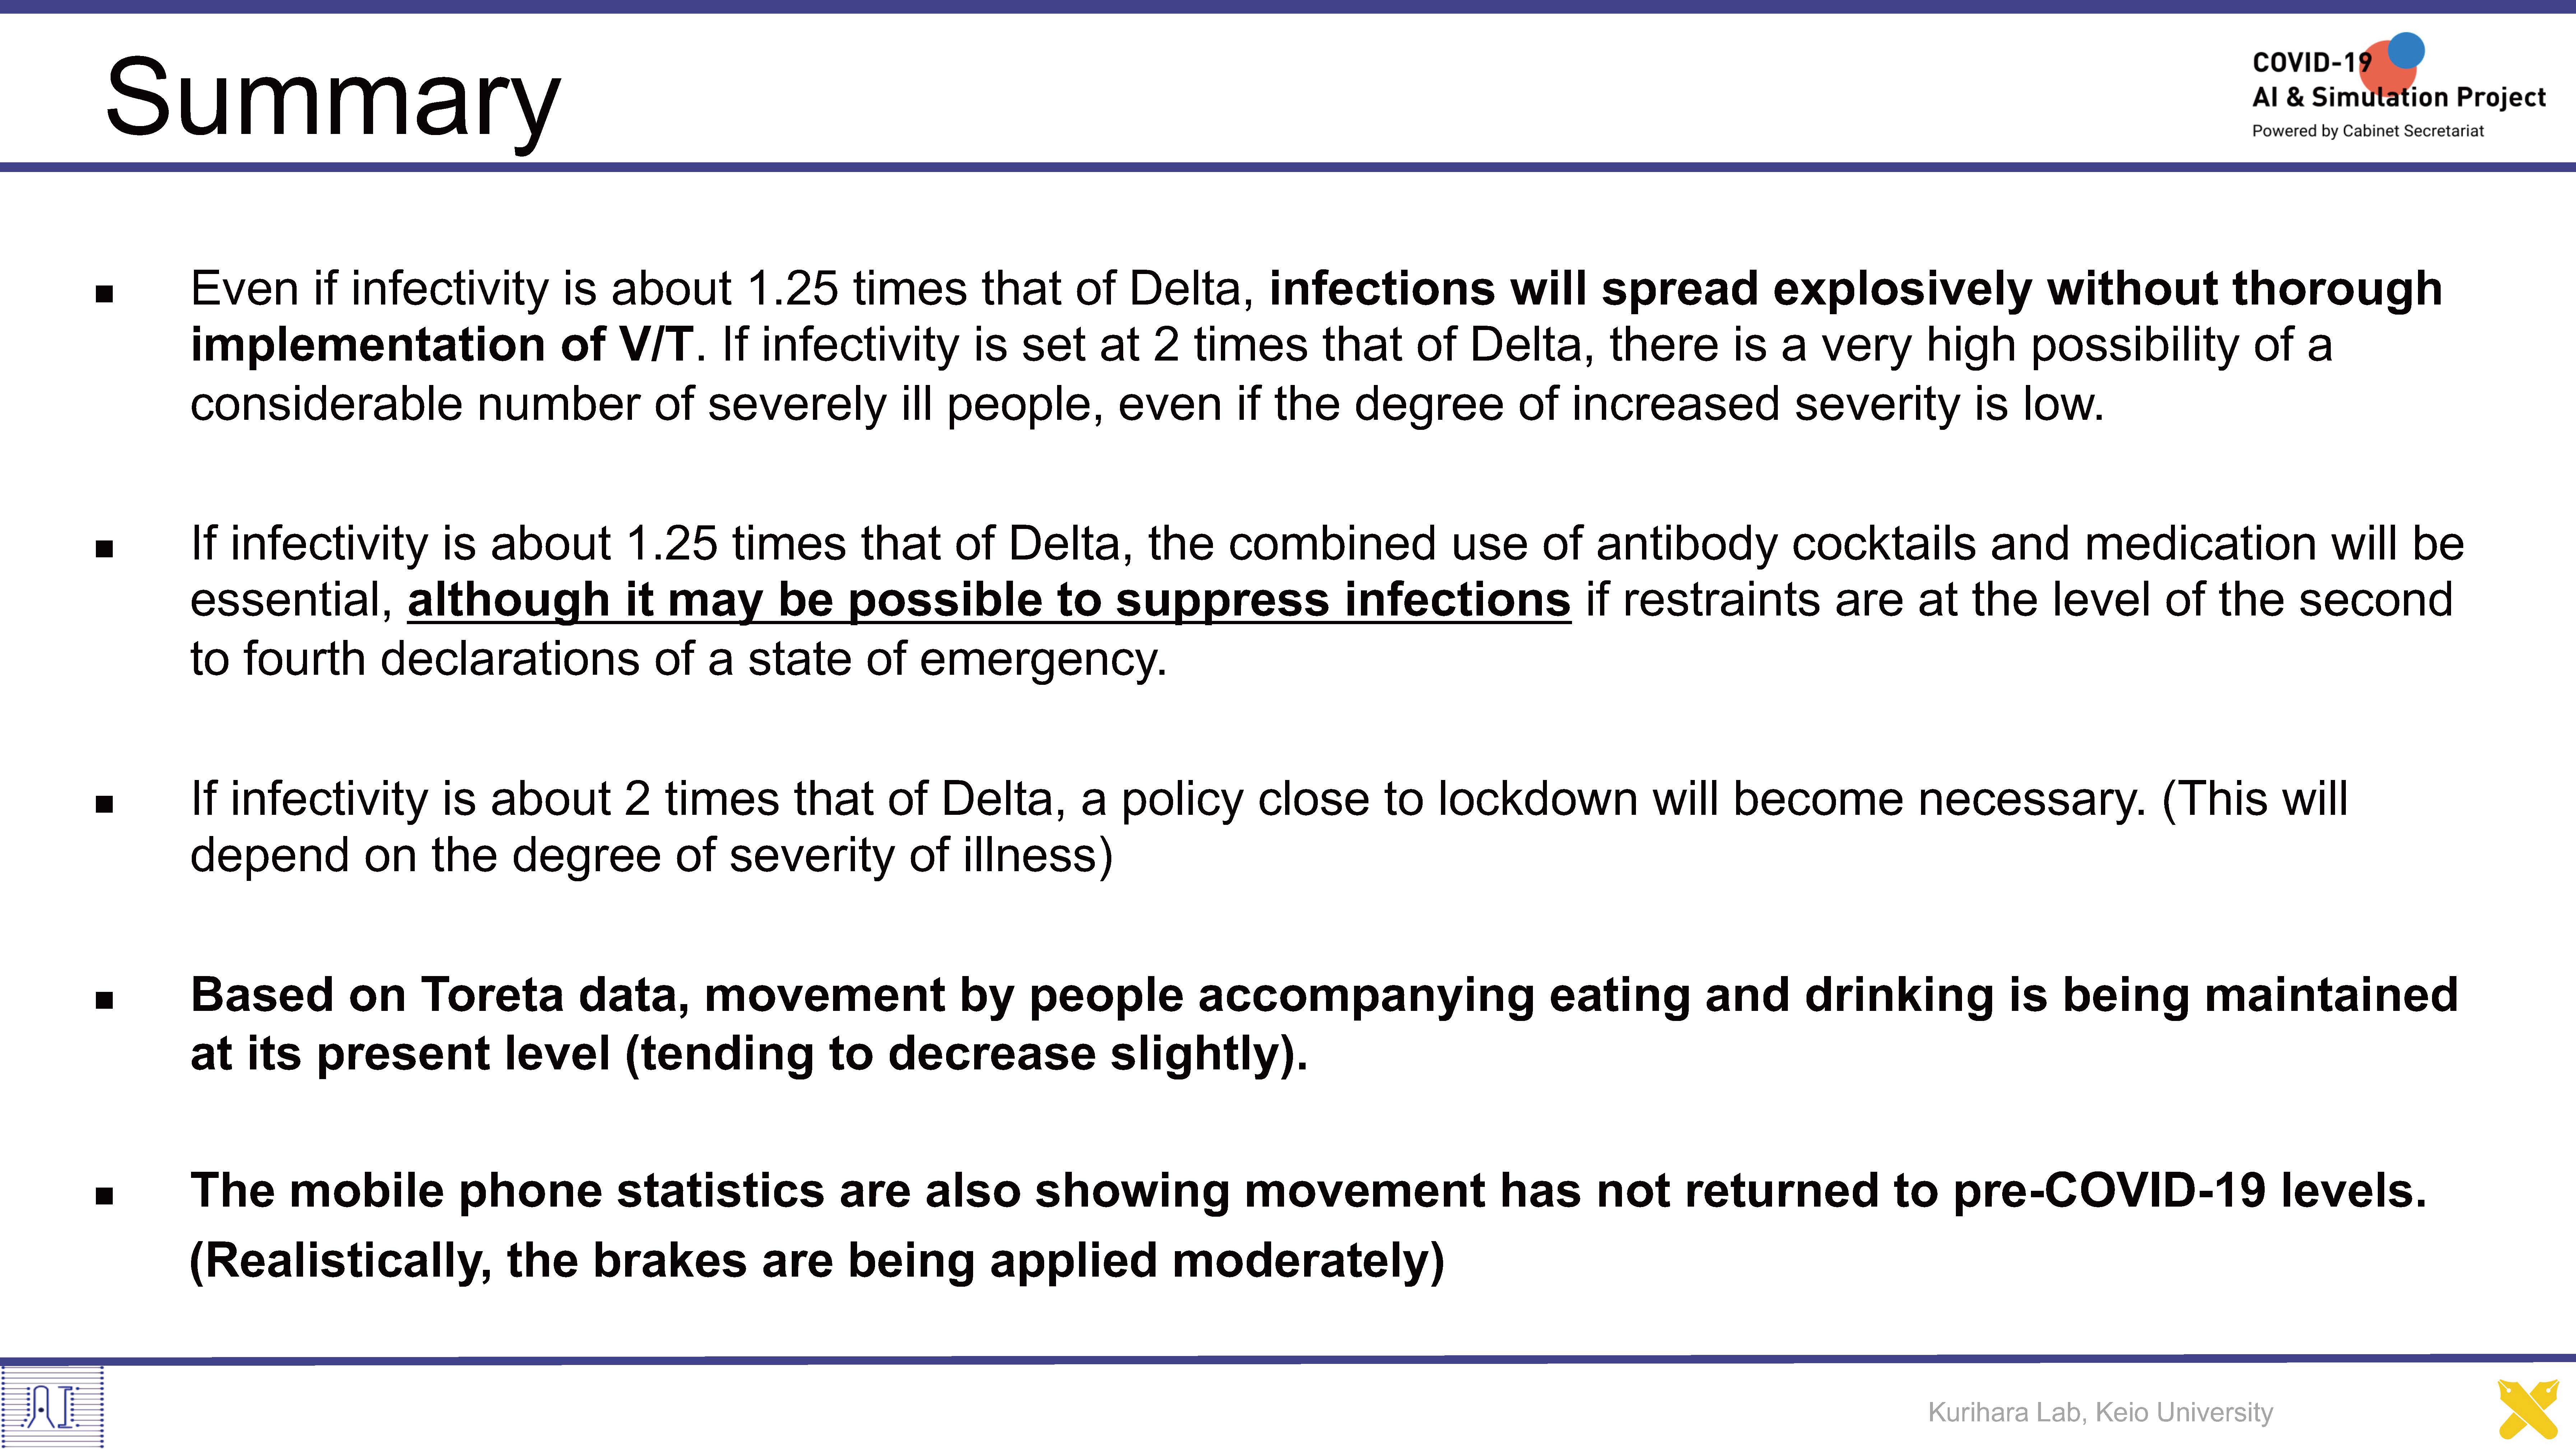
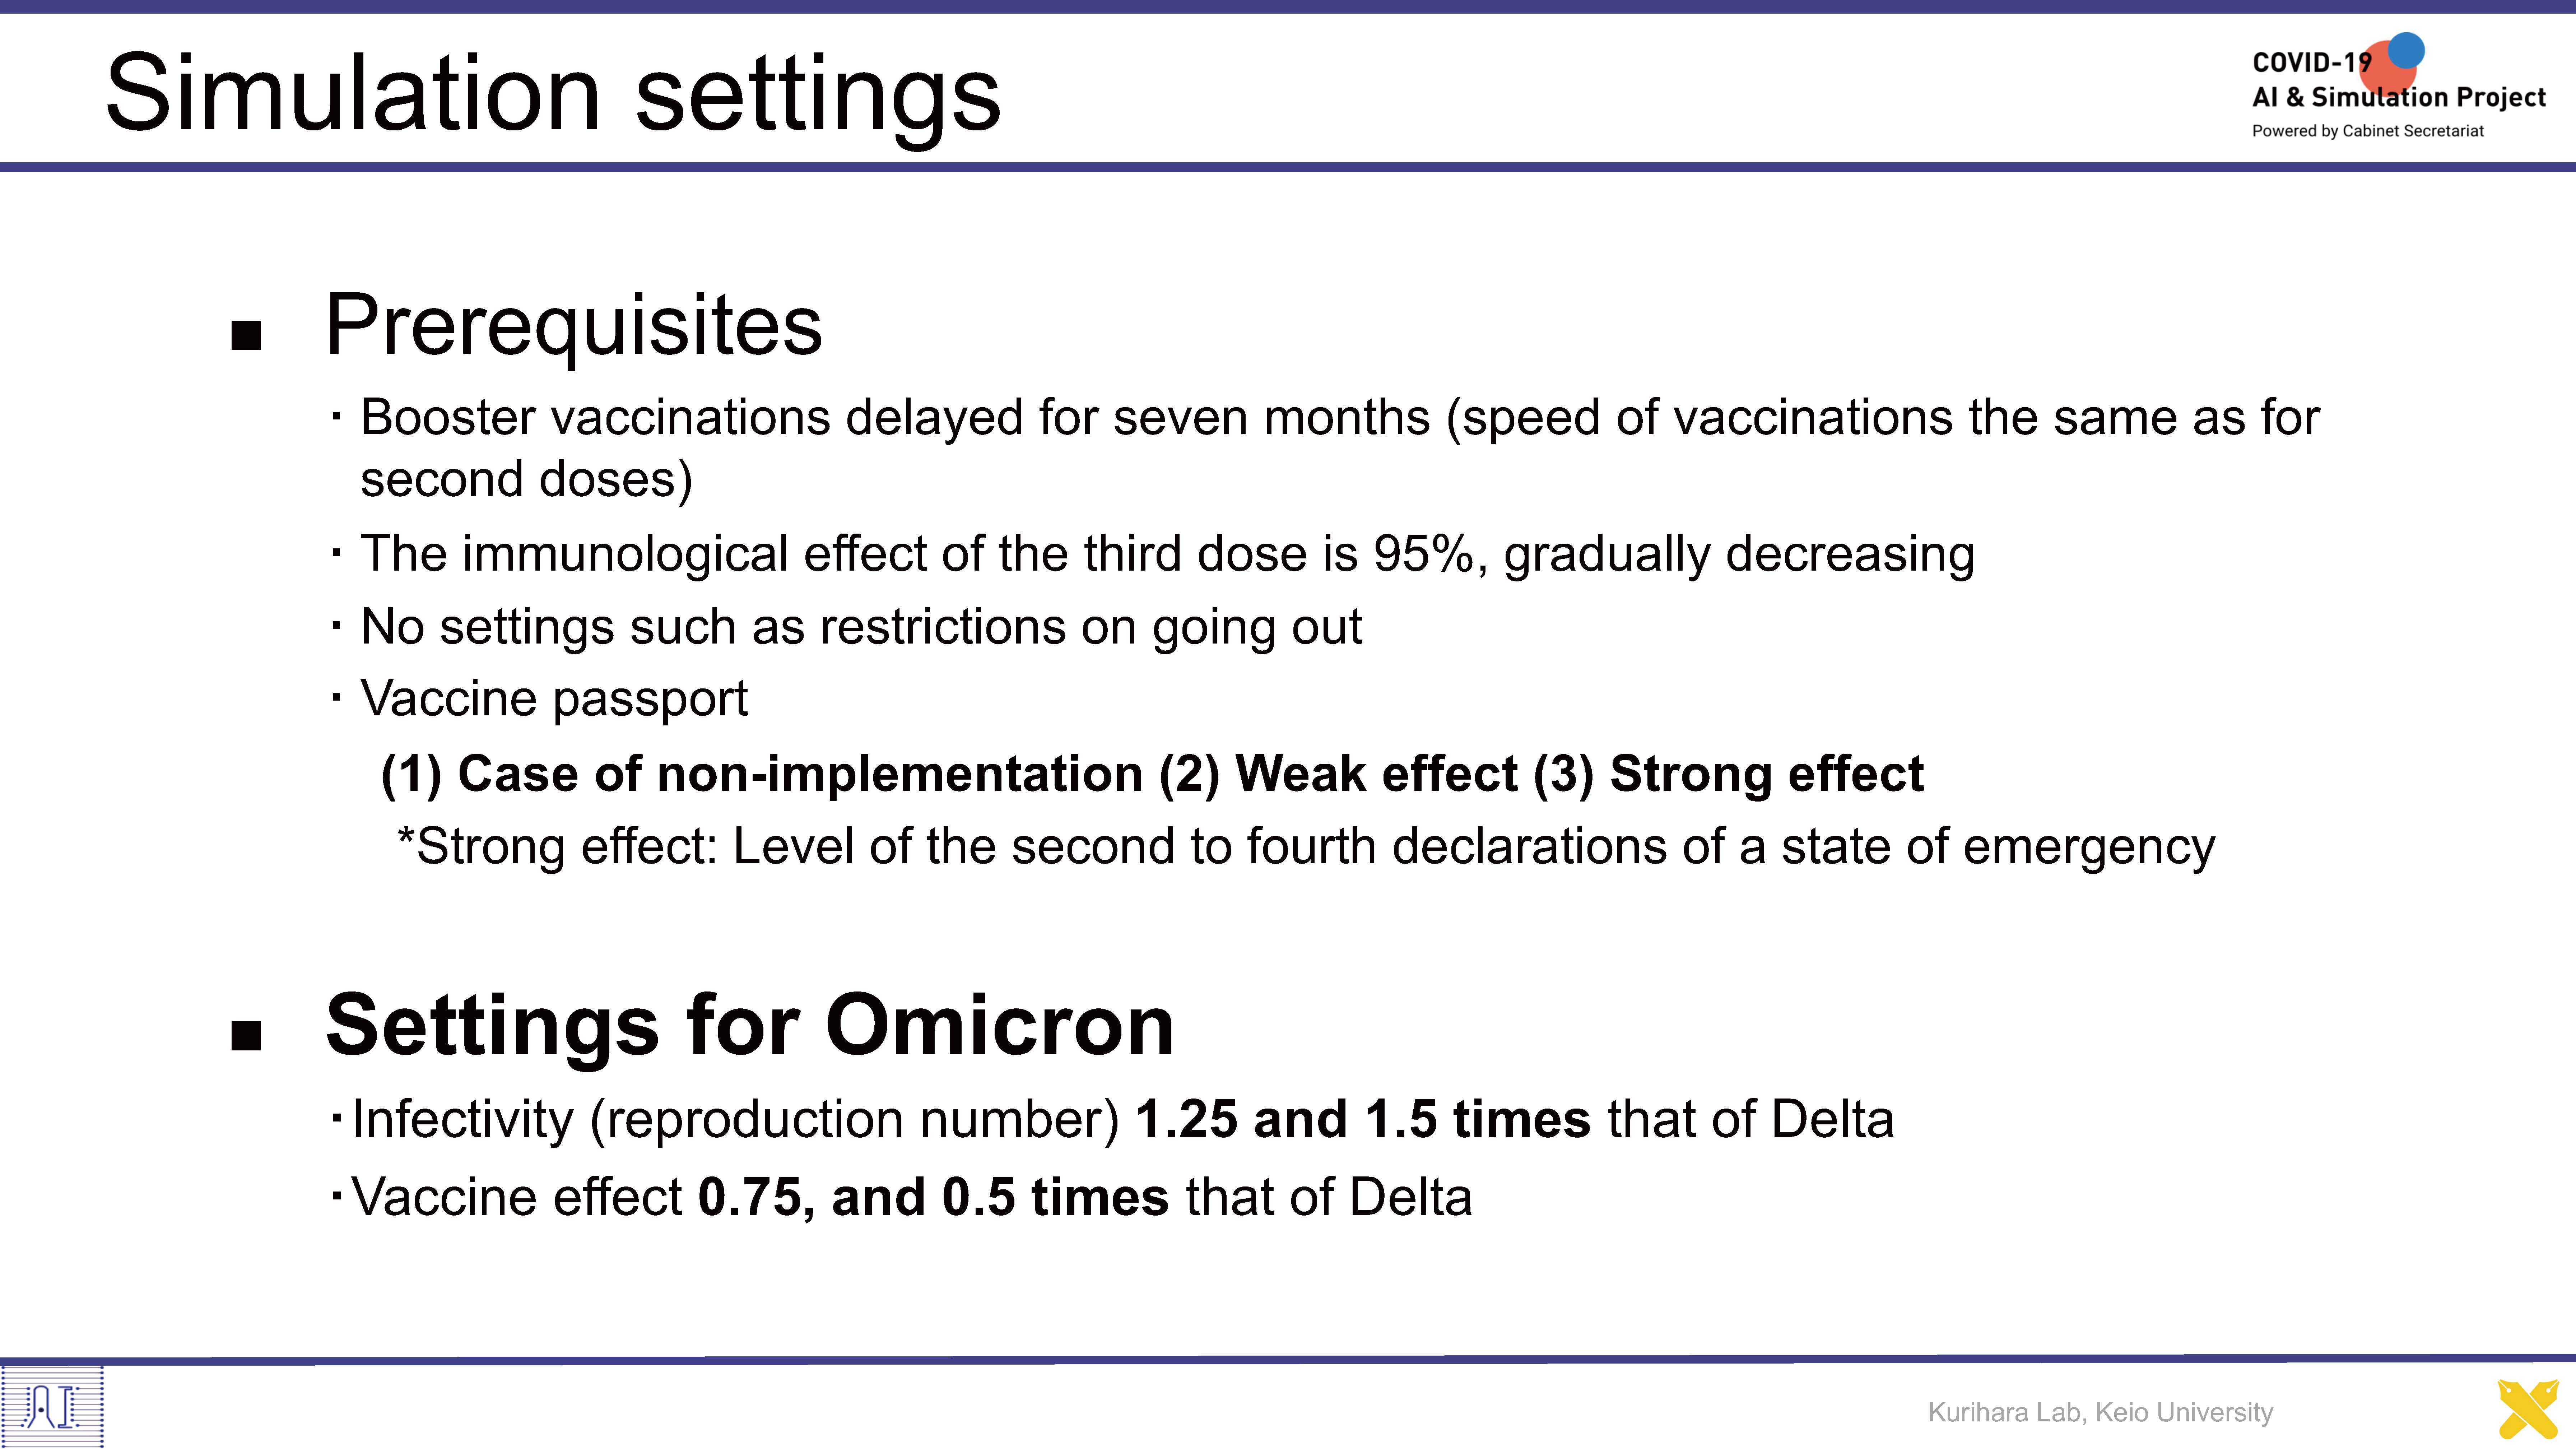
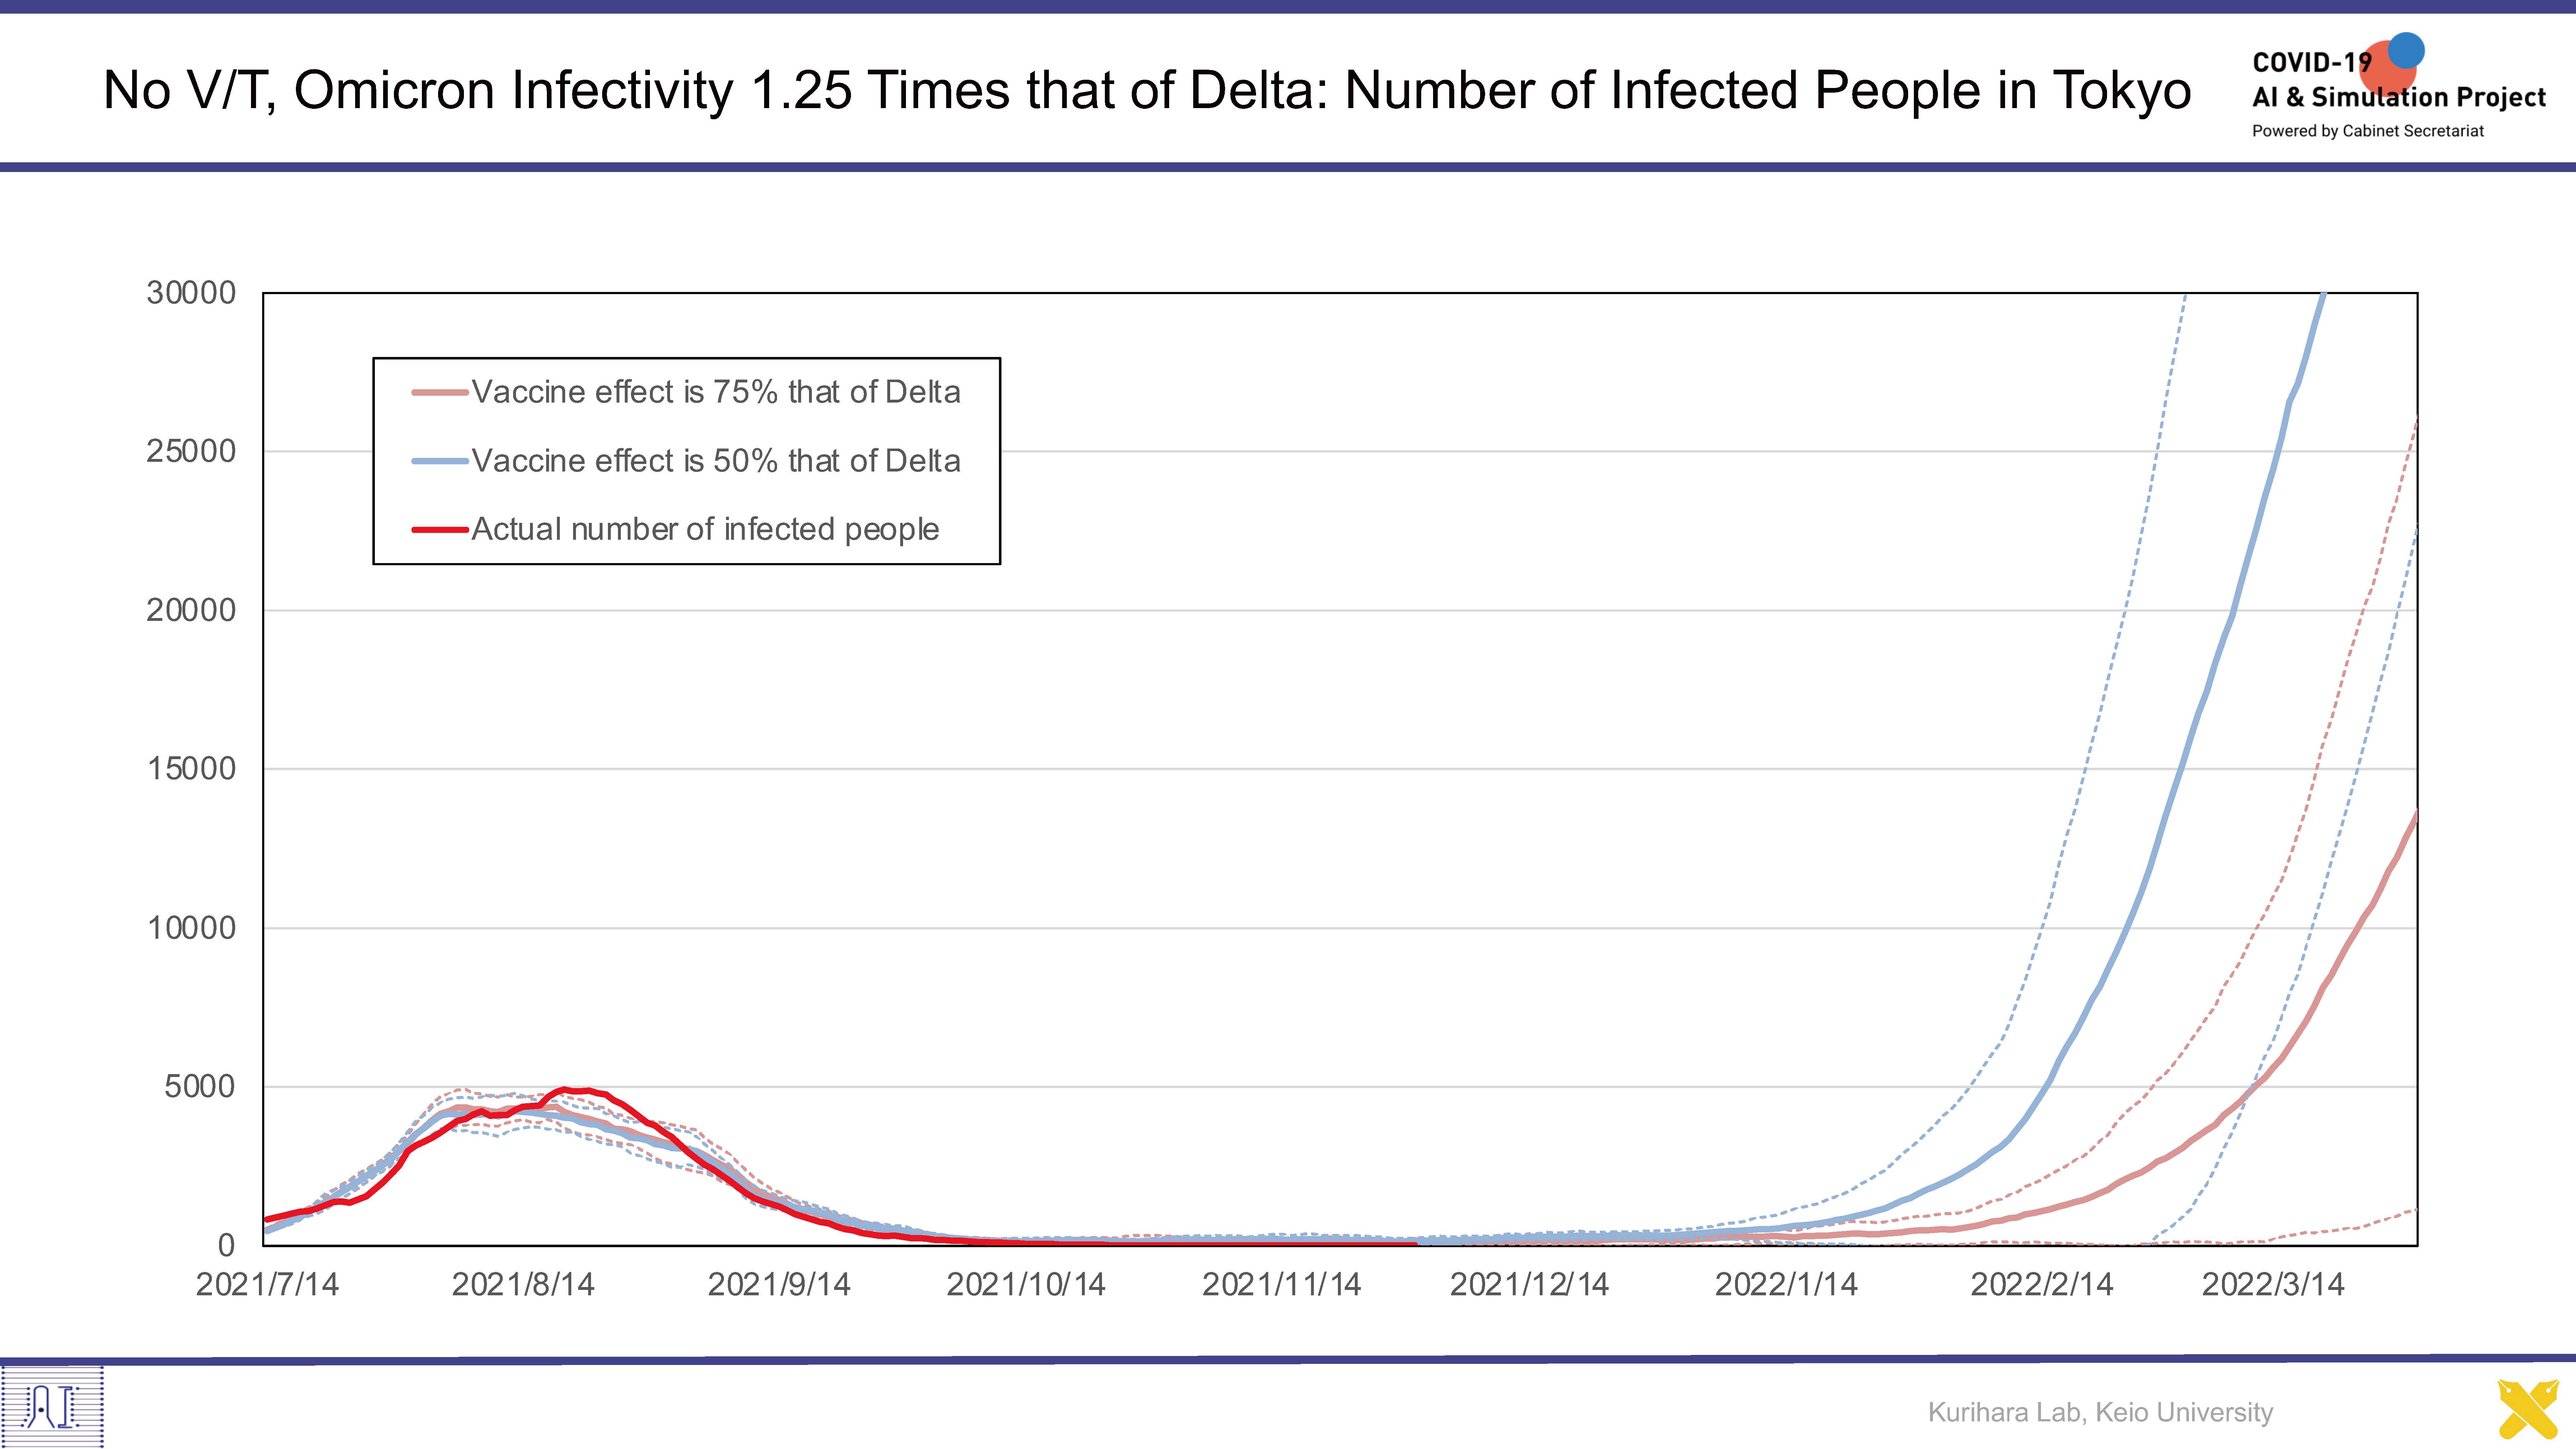
Infection Simulation based on Proposed Human Behavior Models derived from SNS and Press Data #23
2021.12.21
Organization
Faculty of Science and Technology, Keio University
Researcher
Satoshi Kurihara

Researcher
Masashi Toyoda

Infection Simulation based on Proposed Human Behavior Models derived from SNS and Press Data #22
2021.12.14
Organization
Faculty of Science and Technology, Keio University
Researcher
Satoshi Kurihara

Researcher
Masashi Toyoda

Infection Simulation based on Proposed Human Behavior Models derived from SNS and Press Data #21
2021.12.07
Organization
Faculty of Science and Technology, Keio University
Researcher
Satoshi Kurihara

Infection Simulation based on Proposed Human Behavior Models derived from SNS and Press Data #20
2021.11.30
Organization
Faculty of Science and Technology, Keio University
Researcher
Satoshi Kurihara

Researcher
Masashi Toyoda

Infection Simulation based on Proposed Human Behavior Models derived from SNS and Press Data #19
2021.11.16
Organization
Faculty of Science and Technology, Keio University
Researcher
Satoshi Kurihara

Infection Simulation based on Proposed Human Behavior Models derived from SNS and Press Data #18
2021.11.09
Organization
Faculty of Science and Technology, Keio University
Researcher
Satoshi Kurihara
Infection Simulation based on Proposed Human Behavior Models derived from SNS and Press Data #17
2021.10.26
Organization
Faculty of Science and Technology, Keio University
Researcher
Satoshi Kurihara

Researcher
Masashi Toyoda

Researcher
Masashi Toyoda

Infection Simulation based on Proposed Human Behavior Models derived from SNS and Press Data #16
2021.10.12
Organization
Faculty of Science and Technology, Keio University
Researcher
Satoshi Kurihara

Researcher
Masashi Toyoda

Infection Simulation based on Proposed Human Behavior Models derived from SNS and Press Data #15
2021.10.05
Organization
Faculty of Science and Technology, Keio University
Researcher
Satoshi Kurihara

Researcher
Masashi Toyoda

Infection Simulation based on Proposed Human Behavior Models derived from SNS and Press Data #14
2021.09.29
Organization
Faculty of Science and Technology, Keio University
Researcher
Satoshi Kurihara

Researcher
Masashi Toyoda

Infection Simulation based on Proposed Human Behavior Models derived from SNS and Press Data #13
2021.09.21
Organization
Faculty of Science and Technology, Keio University
Researcher
Satoshi Kurihara

Infection Simulation based on Proposed Human Behavior Models derived from SNS and Press Data #12
2021.09.14
Organization
Faculty of Science and Technology, Keio University
Researcher
Satoshi Kurihara

Researcher
Masashi Toyoda

Infection Simulation based on Proposed Human Behavior Models derived from SNS and Press Data #11
2021.09.07
Organization
Faculty of Science and Technology, Keio University
Researcher
Satoshi Kurihara

Infection Simulation based on Proposed Human Behavior Models derived from SNS and Press Data #10
2021.08.31
Organization
Faculty of Science and Technology, Keio University
Researcher
Satoshi Kurihara

Researcher
Masashi Toyoda

Researcher
Masashi Toyoda

Infection Simulation based on Proposed Human Behavior Models derived from SNS and Press Data #9
2021.08.24
Organization
Faculty of Science and Technology, Keio University
Researcher
Satoshi Kurihara

Infection Simulation based on Proposed Human Behavior Models derived from SNS and Press Data #8
2021.08.17
Organization
Faculty of Science and Technology, Keio University
Researcher
Satoshi Kurihara

Infection Simulation based on Proposed Human Behavior Models derived from SNS and Press Data #7
2021.08.10
Organization
Faculty of Science and Technology, Keio University
Researcher
Satoshi Kurihara

Infection Simulation based on Proposed Human Behavior Models derived from SNS and Press Data #6
2021.08.03
Organization
Faculty of Science and Technology, Keio University
Researcher
Satoshi Kurihara

Researcher
Masashi Toyoda

Infection Simulation based on Proposed Human Behavior Models derived from SNS and Press Data #5
2021.07.27
Organization
Faculty of Science and Technology, Keio University
Researcher
Satoshi Kurihara

Infection Simulation based on Proposed Human Behavior Models derived from SNS and Press Data #4
2021.07.20
Organization
Faculty of Science and Technology, Keio University
Researcher
Satoshi Kurihara

Researcher
Masashi Toyoda
Infection Simulation based on Proposed Human Behavior Models derived from SNS and Press Data #3
2021.07.12
Organization
Faculty of Science and Technology, Keio University
Researcher
Satoshi Kurihara

Organization
Faculty of Science and Technology, Keio University
Researcher
Satoshi Kurihara
