- HOME
- Reports
- Simulations for infection situations
- Summary of empirical analysis on behavioral restrictions and information effects (fear effects)
Summary of empirical analysis on behavioral restrictions and information effects (fear effects)
/
-
東京大学
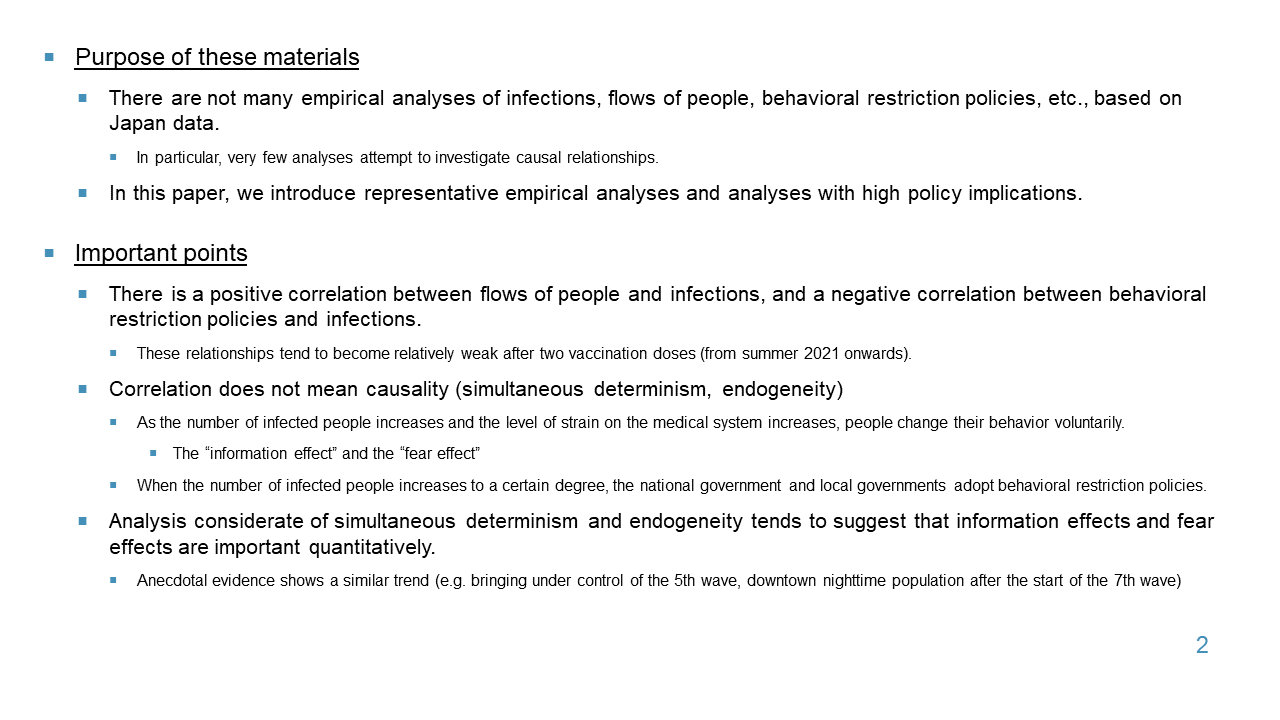
・Purpose of these materials
・There are not many empirical analyses of infections, flows of people, behavioral restriction policies, etc., based on Japan data.
・In particular, very few analyses attempt to investigate causal relationships.
・In this paper, we introduce representative empirical analyses and analyses with high policy implications.
・Important points
・There is a positive correlation between flows of people and infections, and a negative correlation between behavioral restriction policies and infections.
・These relationships tend to become relatively weak after two vaccination doses (from summer 2021 onwards).
・Correlation does not mean causality (simultaneous determinism, endogeneity)
・As the number of infected people increases and the level of strain on the medical system increases, people change their behavior voluntarily.
・The “information effect” and the “fear effect”
・When the number of infected people increases to a certain degree, the national government and local governments adopt behavioral restriction policies.
・Analysis considerate of simultaneous determinism and endogeneity tends to suggest that information effects and fear effects are important quantitatively.
・Anecdotal evidence shows a similar trend (e.g. bringing under control of the 5th wave, downtown nighttime population after the start of the 7th wave)
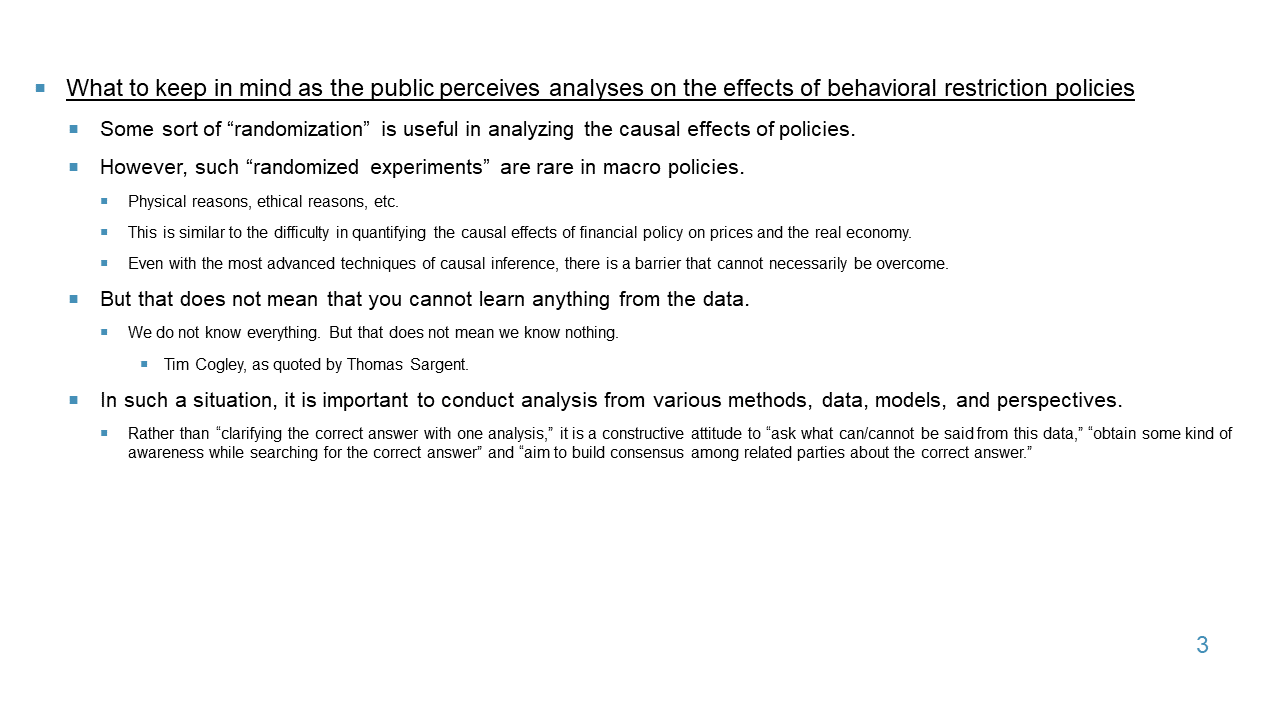
・What to keep in mind as the public perceives analyses on the effects of behavioral restriction policies
・Some sort of “randomization” is useful in analyzing the causal effects of policies.
・However, such “randomized experiments” are rare in macro policies.
・Physical reasons, ethical reasons, etc.
・This is similar to the difficulty in quantifying the causal effects of financial policy on prices and the real economy.
・Even with the most advanced techniques of causal inference, there is a barrier that cannot necessarily be overcome.
・But that does not mean that you cannot learn anything from the data.
・We do not know everything. But that does not mean we know nothing.
・Tim Cogley, as quoted by Thomas Sargent.
・In such a situation, it is important to conduct analysis from various methods, data, models, and perspectives.
・Rather than “clarifying the correct answer with one analysis,” it is a constructive attitude to “ask what can/cannot be said from this data,” “obtain some kind of awareness while searching for the correct answer” and “aim to build consensus among related parties about the correct answer.”
Empirical research on behavioral restriction policies and information effects (fear effects), etc., using Japan data
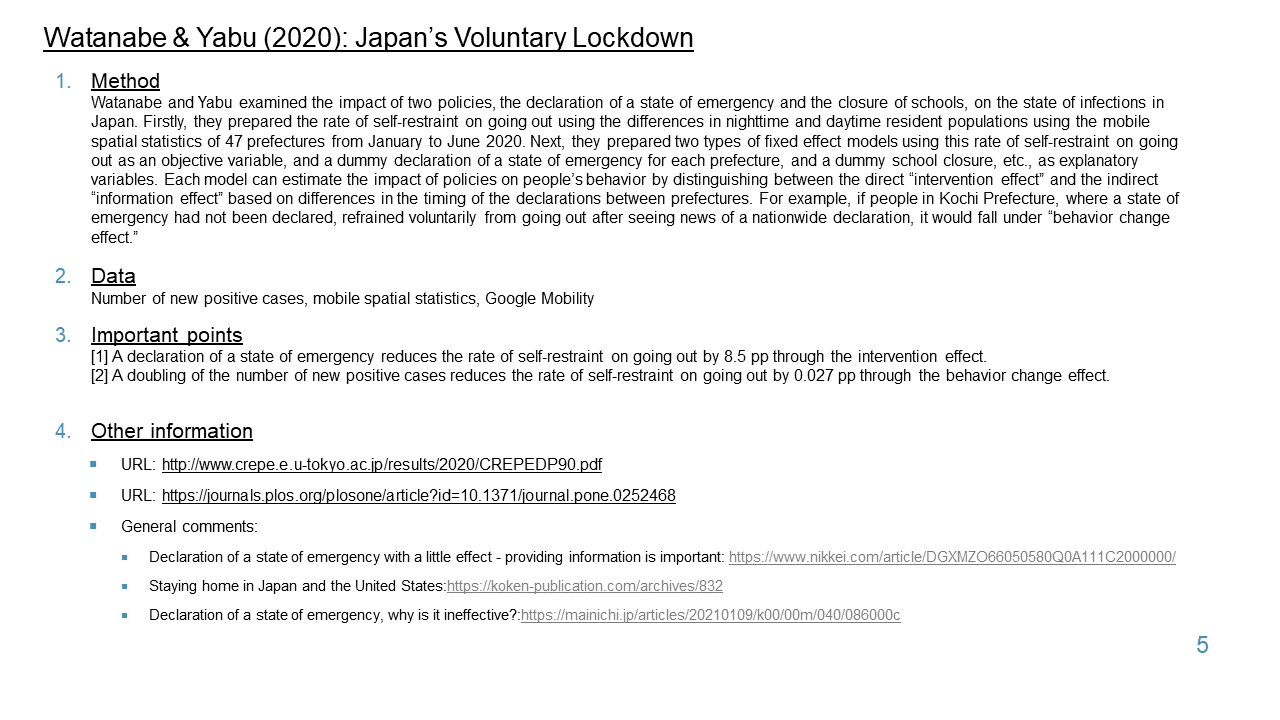
Watanabe & Yabu (2020): Japan’s Voluntary Lockdown
1. Method
Watanabe and Yabu examined the impact of two policies, the declaration of a state of emergency and the closure of schools, on the state of infections in Japan. Firstly, they prepared the rate of self-restraint on going out using the differences in nighttime and daytime resident populations using the mobile spatial statistics of 47 prefectures from January to June 2020. Next, they prepared two types of fixed effect models using this rate of self-restraint on going out as an objective variable, and a dummy declaration of a state of emergency for each prefecture, and a dummy school closure, etc., as explanatory variables. Each model can estimate the impact of policies on people’s behavior by distinguishing between the direct “intervention effect” and the indirect “information effect” based on differences in the timing of the declarations between prefectures. For example, if people in Kochi Prefecture, where a state of emergency had not been declared, refrained voluntarily from going out after seeing news of a nationwide declaration, it would fall under “behavior change effect.”
2. Data
Number of new positive cases, mobile spatial statistics, Google Mobility
3. Important points
[1] A declaration of a state of emergency reduces the rate of self-restraint on going out by 8.5 pp through the intervention effect.
[2] A doubling of the number of new positive cases reduces the rate of self-restraint on going out by 0.027 pp through the behavior change effect.
4. Other information
・URL: http://www.crepe.e.u-tokyo.ac.jp/results/2020/CREPEDP90.pdf
・URL: https://journals.plos.org/plosone/article?id=10.1371/journal.pone.0252468
・General comments:
・Declaration of a state of emergency with a little effect - providing information is important: https://www.nikkei.com/article/DGXMZO66050580Q0A111C2000000/
・Staying home in Japan and the United States:https://koken-publication.com/archives/832
・Declaration of a state of emergency, why is it ineffective?:https://mainichi.jp/articles/20210109/k00/00m/040/086000c
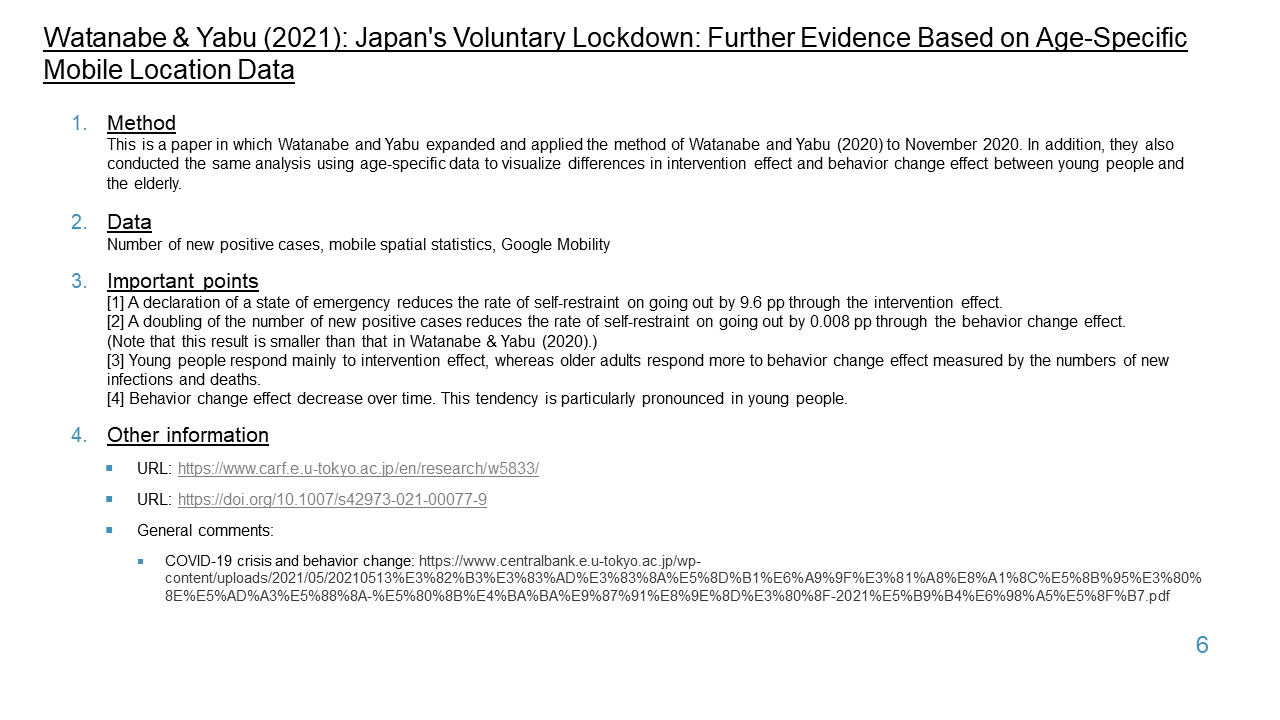
Watanabe & Yabu (2021): Japan's Voluntary Lockdown: Further Evidence Based on Age-Specific Mobile Location Data
1. Method
This is a paper in which Watanabe and Yabu expanded and applied the method of Watanabe and Yabu (2020) to November 2020. In addition, they also conducted the same analysis using age-specific data to visualize differences in intervention effect and behavior change effect between young people and the elderly.
2. Data
Number of new positive cases, mobile spatial statistics, Google Mobility
3. Important points
[1] A declaration of a state of emergency reduces the rate of self-restraint on going out by 9.6 pp through the intervention effect.
[2] A doubling of the number of new positive cases reduces the rate of self-restraint on going out by 0.008 pp through the behavior change effect.
(Note that this result is smaller than that in Watanabe & Yabu (2020).)
[3] Young people respond mainly to intervention effect, whereas older adults respond more to behavior change effect measured by the numbers of new infections and deaths.
[4] Behavior change effect decrease over time. This tendency is particularly pronounced in young people.
4. Other information
・URL: https://www.carf.e.u-tokyo.ac.jp/en/research/w5833/
・URL: https://doi.org/10.1007/s42973-021-00077-9
・General comments:
・COVID-19 crisis and behavior change: https://www.centralbank.e.u-tokyo.ac.jp/wp-content/uploads/2021/05/20210513%E3%82%B3%E3%83%AD%E3%83%8A%E5%8D%B1%E6%A9%9F%E3%81%A8%E8%A1%8C%E5%8B%95%E3%80%8E%E5%AD%A3%E5%88%8A-%E5%80%8B%E4%BA%BA%E9%87%91%E8%9E%8D%E3%80%8F-2021%E5%B9%B4%E6%98%A5%E5%8F%B7.pdf
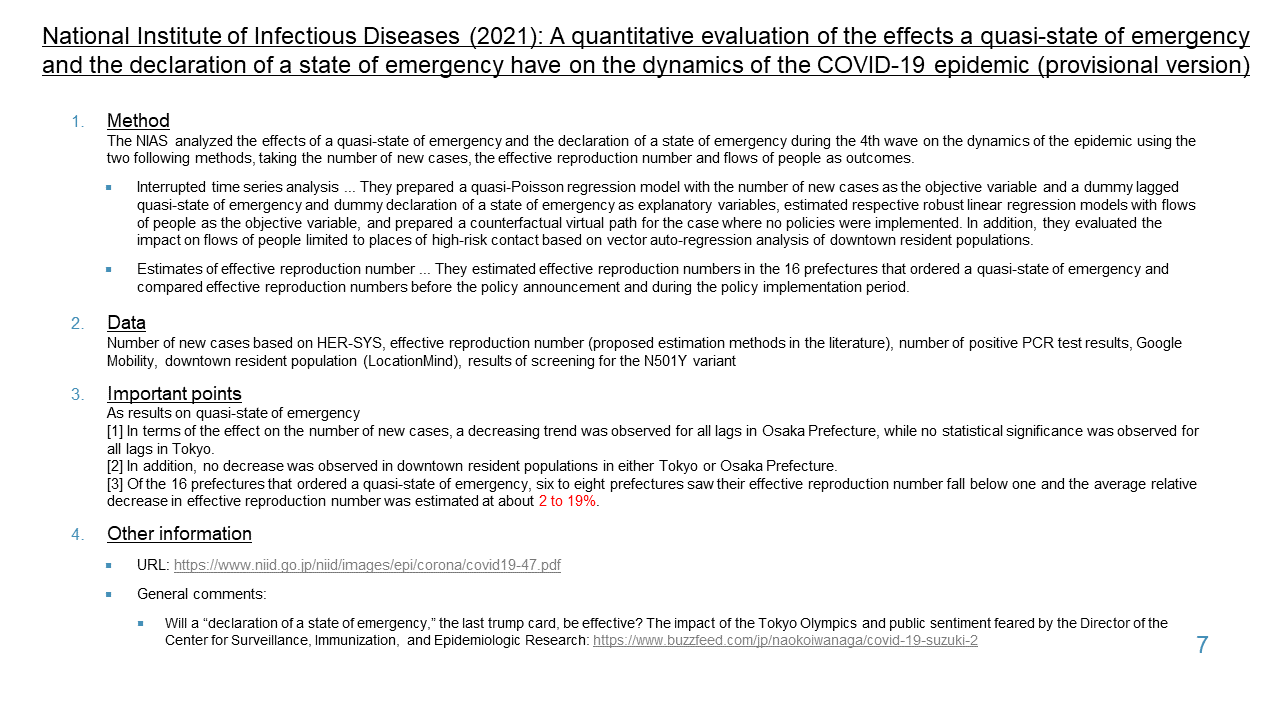
National Institute of Infectious Diseases (2021): A quantitative evaluation of the effects a quasi-state of emergency and the declaration of a state of emergency have on the dynamics of the COVID-19 epidemic (provisional version)
1. Method
The NIAS analyzed the effects of a quasi-state of emergency and the declaration of a state of emergency during the 4th wave on the dynamics of the epidemic using the two following methods, taking the number of new cases, the effective reproduction number and flows of people as outcomes.
・Interrupted time series analysis ... They prepared a quasi-Poisson regression model with the number of new cases as the objective variable and a dummy lagged quasi-state of emergency and dummy declaration of a state of emergency as explanatory variables, estimated respective robust linear regression models with flows of people as the objective variable, and prepared a counterfactual virtual path for the case where no policies were implemented. In addition, they evaluated the impact on flows of people limited to places of high-risk contact based on vector auto-regression analysis of downtown resident populations.
・Estimates of effective reproduction number ... They estimated effective reproduction numbers in the 16 prefectures that ordered a quasi-state of emergency and compared effective reproduction numbers before the policy announcement and during the policy implementation period.
2. Data
Number of new cases based on HER-SYS, effective reproduction number (proposed estimation methods in the literature), number of positive PCR test results, Google Mobility, downtown resident population (LocationMind), results of screening for the N501Y variant
3. Important points
As results on quasi-state of emergency
[1] In terms of the effect on the number of new cases, a decreasing trend was observed for all lags in Osaka Prefecture, while no statistical significance was observed for all lags in Tokyo.
[2] In addition, no decrease was observed in downtown resident populations in either Tokyo or Osaka Prefecture.
[3] Of the 16 prefectures that ordered a quasi-state of emergency, six to eight prefectures saw their effective reproduction number fall below one and the average relative decrease in effective reproduction number was estimated at about 2 to 19%.
4. Other information
・URL: https://www.niid.go.jp/niid/images/epi/corona/covid19-47.pdf
・General comments:
・Will a “declaration of a state of emergency,” the last trump card, be effective? The impact of the Tokyo Olympics and public sentiment feared by the Director of the Center for Surveillance, Immunization, and Epidemiologic Research:
https://www.buzzfeed.com/jp/naokoiwanaga/covid-19-suzuki-2
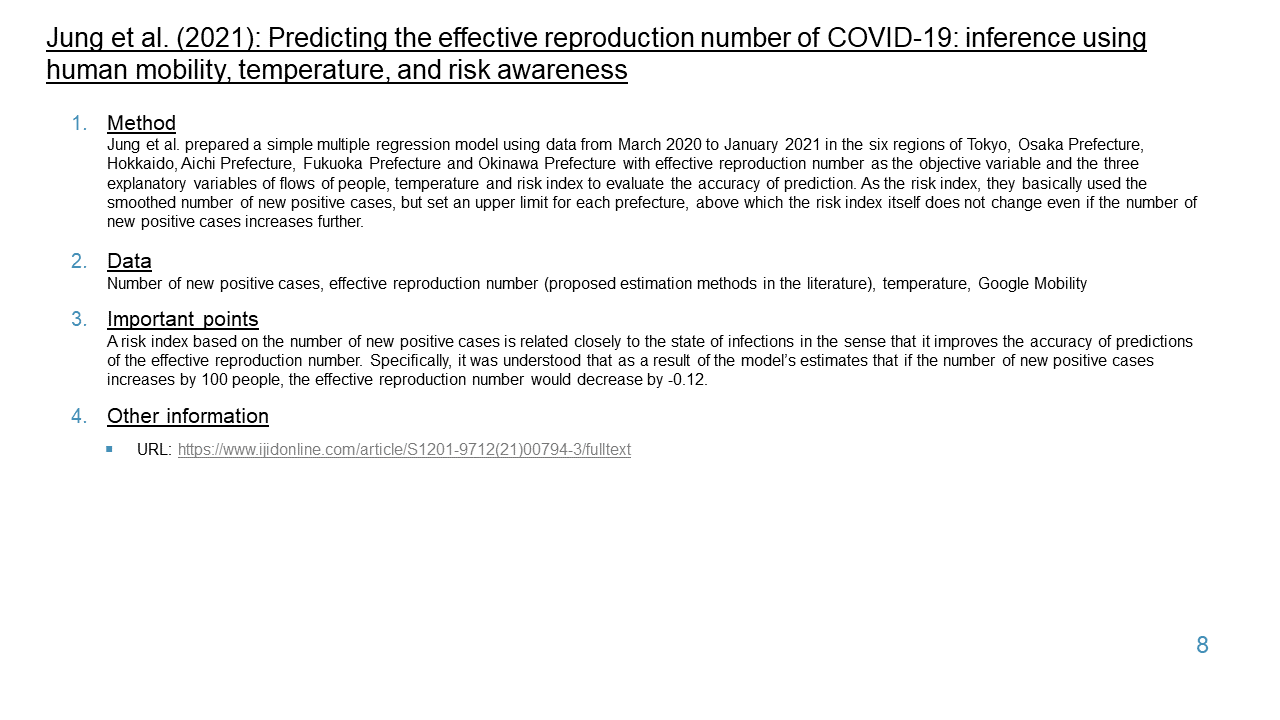
Jung et al. (2021): Predicting the effective reproduction number of COVID-19: inference using human mobility, temperature, and risk awareness
1. Method
Jung et al. prepared a simple multiple regression model using data from March 2020 to January 2021 in the six regions of Tokyo, Osaka Prefecture, Hokkaido, Aichi Prefecture, Fukuoka Prefecture and Okinawa Prefecture with effective reproduction number as the objective variable and the three explanatory variables of flows of people, temperature and risk index to evaluate the accuracy of prediction. As the risk index, they basically used the smoothed number of new positive cases, but set an upper limit for each prefecture, above which the risk index itself does not change even if the number of new positive cases increases further.
2. Data
Number of new positive cases, effective reproduction number (proposed estimation methods in the literature), temperature, Google Mobility
3. Important points
A risk index based on the number of new positive cases is related closely to the state of infections in the sense that it improves the accuracy of predictions of the effective reproduction number. Specifically, it was understood that as a result of the model’s estimates that if the number of new positive cases increases by 100 people, the effective reproduction number would decrease by -0.12.
4. Other information
・URL: https://www.ijidonline.com/article/S1201-9712(21)00794-3/fulltext
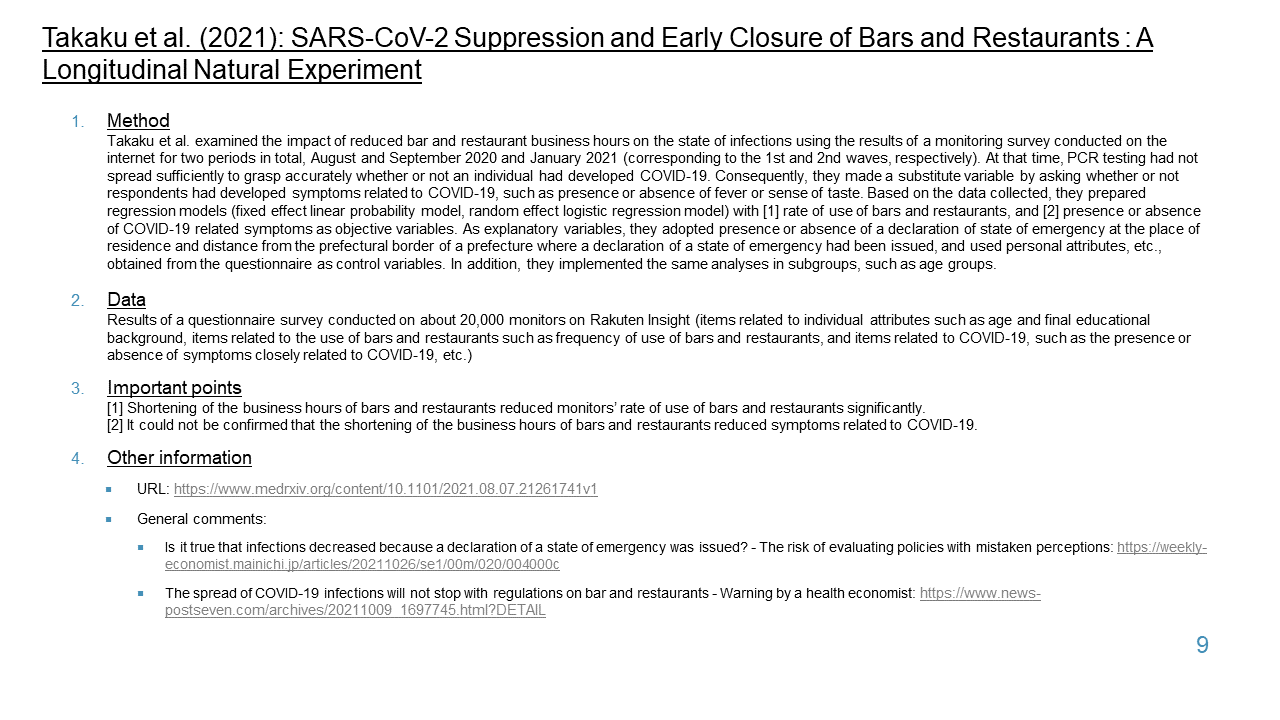
Takaku et al. (2021): SARS-CoV-2 Suppression and Early Closure of Bars and Restaurants : A Longitudinal Natural Experiment
1. Method
Takaku et al. examined the impact of reduced bar and restaurant business hours on the state of infections using the results of a monitoring survey conducted on the internet for two periods in total, August and September 2020 and January 2021 (corresponding to the 1st and 2nd waves, respectively). At that time, PCR testing had not spread sufficiently to grasp accurately whether or not an individual had developed COVID-19. Consequently, they made a substitute variable by asking whether or not respondents had developed symptoms related to COVID-19, such as presence or absence of fever or sense of taste. Based on the data collected, they prepared regression models (fixed effect linear probability model, random effect logistic regression model) with [1] rate of use of bars and restaurants, and [2] presence or absence of COVID-19 related symptoms as objective variables. As explanatory variables, they adopted presence or absence of a declaration of state of emergency at the place of residence and distance from the prefectural border of a prefecture where a declaration of a state of emergency had been issued, and used personal attributes, etc., obtained from the questionnaire as control variables. In addition, they implemented the same analyses in subgroups, such as age groups.
2. Data
Results of a questionnaire survey conducted on about 20,000 monitors on Rakuten Insight (items related to individual attributes such as age and final educational background, items related to the use of bars and restaurants such as frequency of use of bars and restaurants, and items related to COVID-19, such as the presence or absence of symptoms closely related to COVID-19, etc.)
3. Important points
[1] Shortening of the business hours of bars and restaurants reduced monitors’ rate of use of bars and restaurants significantly.
[2] It could not be confirmed that the shortening of the business hours of bars and restaurants reduced symptoms related to COVID-19.
4. Other information
・URL: https://www.medrxiv.org/content/10.1101/2021.08.07.21261741v1
・General comments:
Is it true that infections decreased because a declaration of a state of emergency was issued? - The risk of evaluating policies with mistaken perceptions:
https://weekly-economist.mainichi.jp/articles/20211026/se1/00m/020/004000c
The spread of COVID-19 infections will not stop with regulations on bar and restaurants - Warning by a health economist:
https://www.news-postseven.com/archives/20211009_1697745.html?DETAIL
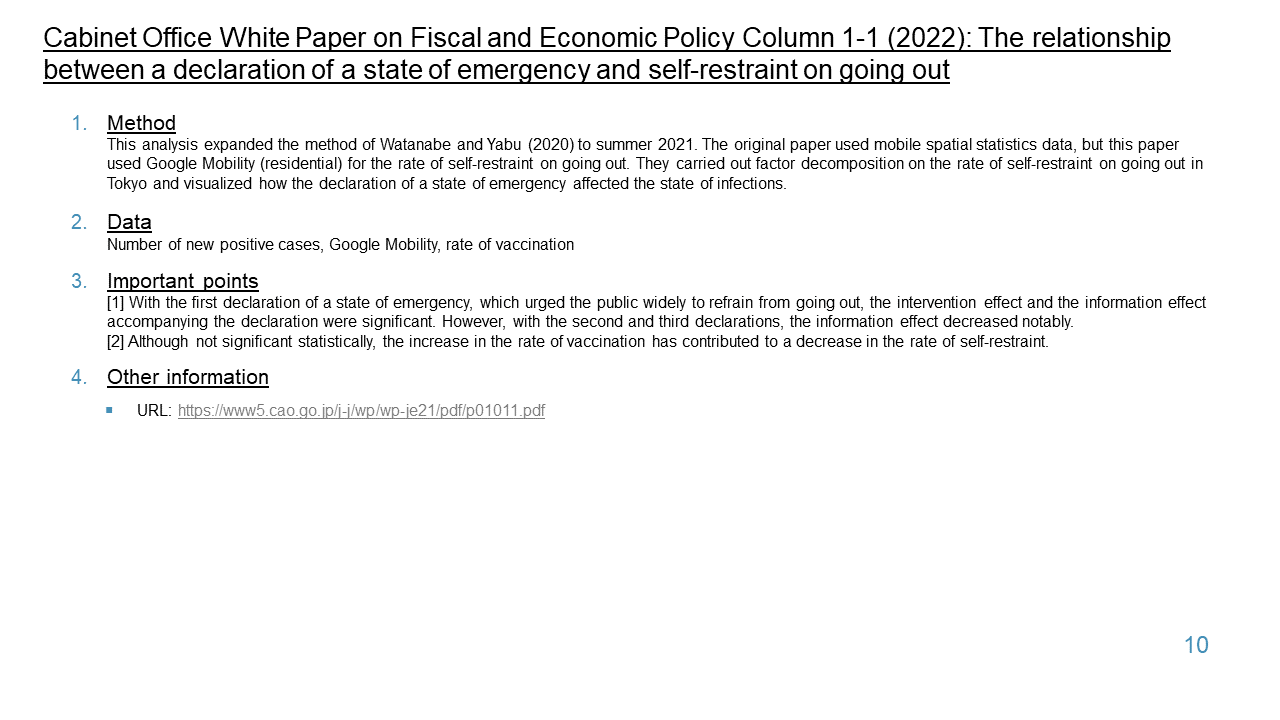
Cabinet Office White Paper on Fiscal and Economic Policy Column 1-1 (2022): The relationship between a declaration of a state of emergency and self-restraint on going out
1. Method
This analysis expanded the method of Watanabe and Yabu (2020) to summer 2021. The original paper used mobile spatial statistics data, but this paper used Google Mobility (residential) for the rate of self-restraint on going out. They carried out factor decomposition on the rate of self-restraint on going out in Tokyo and visualized how the declaration of a state of emergency affected the state of infections.
2. Data
Number of new positive cases, Google Mobility, rate of vaccination
3. Important points
[1] With the first declaration of a state of emergency, which urged the public widely to refrain from going out, the intervention effect and the information effect accompanying the declaration were significant. However, with the second and third declarations, the information effect decreased notably.
[2] Although not significant statistically, the increase in the rate of vaccination has contributed to a decrease in the rate of self-restraint.
4. Other information
・URL: https://www5.cao.go.jp/j-j/wp/wp-je21/pdf/p01011.pdf
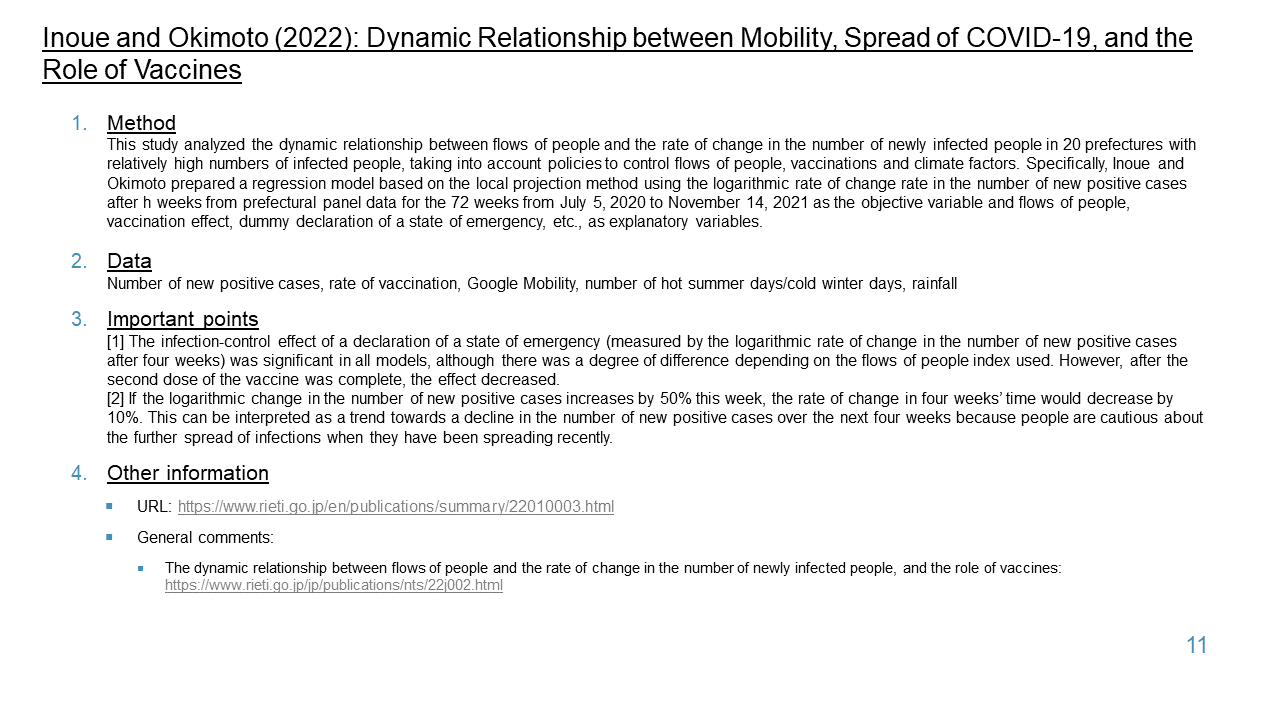
Inoue and Okimoto (2022): Dynamic Relationship between Mobility, Spread of COVID-19, and the Role of Vaccines
1. Method
This study analyzed the dynamic relationship between flows of people and the rate of change in the number of newly infected people in 20 prefectures with relatively high numbers of infected people, taking into account policies to control flows of people, vaccinations and climate factors. Specifically, Inoue and Okimoto prepared a regression model based on the local projection method using the logarithmic rate of change rate in the number of new positive cases after h weeks from prefectural panel data for the 72 weeks from July 5, 2020 to November 14, 2021 as the objective variable and flows of people, vaccination effect, dummy declaration of a state of emergency, etc., as explanatory variables.
2. Data
Number of new positive cases, rate of vaccination, Google Mobility, number of hot summer days/cold winter days, rainfall
3. Important points
[1] The infection-control effect of a declaration of a state of emergency (measured by the logarithmic rate of change in the number of new positive cases after four weeks) was significant in all models, although there was a degree of difference depending on the flows of people index used. However, after the second dose of the vaccine was complete, the effect decreased.
[2] If the logarithmic change in the number of new positive cases increases by 50% this week, the rate of change in four weeks’ time would decrease by 10%. This can be interpreted as a trend towards a decline in the number of new positive cases over the next four weeks because people are cautious about the further spread of infections when they have been spreading recently.
4. Other information
・URL: https://www.rieti.go.jp/en/publications/summary/22010003.html
・General comments:
・The dynamic relationship between flows of people and the rate of change in the number of newly infected people, and the role of vaccines:https://www.rieti.go.jp/jp/publications/nts/22j002.html
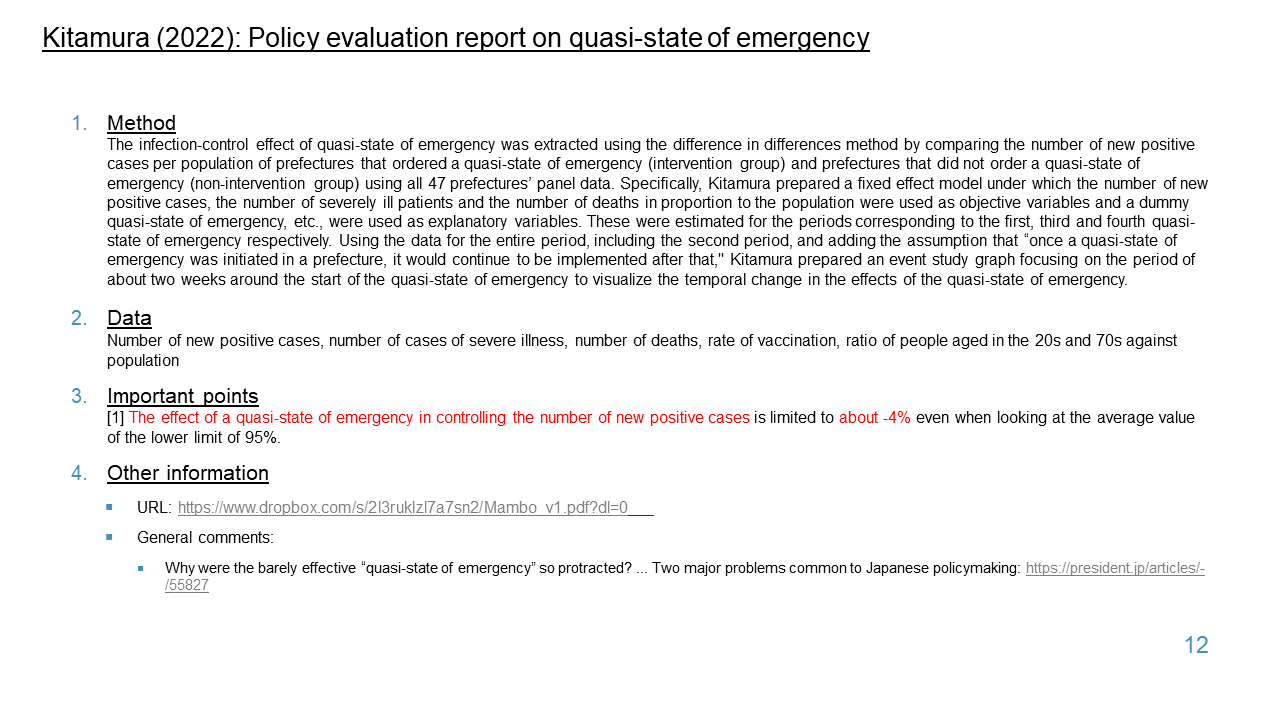
Kitamura (2022): Policy evaluation report on quasi-state of emergency
1. Method
The infection-control effect of quasi-state of emergency was extracted using the difference in differences method by comparing the number of new positive cases per population of prefectures that ordered a quasi-state of emergency (intervention group) and prefectures that did not order a quasi-state of emergency (non-intervention group) using all 47 prefectures’ panel data. Specifically, Kitamura prepared a fixed effect model under which the number of new positive cases, the number of severely ill patients and the number of deaths in proportion to the population were used as objective variables and a dummy quasi-state of emergency, etc., were used as explanatory variables. These were estimated for the periods corresponding to the first, third and fourth quasi-state of emergency respectively. Using the data for the entire period, including the second period, and adding the assumption that “once a quasi-state of emergency was initiated in a prefecture, it would continue to be implemented after that," Kitamura prepared an event study graph focusing on the period of about two weeks around the start of the quasi-state of emergency to visualize the temporal change in the effects of the quasi-state of emergency.
2. Data
Number of new positive cases, number of cases of severe illness, number of deaths, rate of vaccination, ratio of people aged in the 20s and 70s against population
3. Important points
[1] The effect of a quasi-state of emergency in controlling the number of new positive cases is limited to about -4% even when looking at the average value of the lower limit of 95%.
4. Other information
・URL: https://www.dropbox.com/s/2l3ruklzl7a7sn2/Mambo_v1.pdf?dl=0
・General comments:
・Why were the barely effective “quasi-state of emergency” so protracted? ... Two major problems common to Japanese policymaking: https://president.jp/articles/-/55827
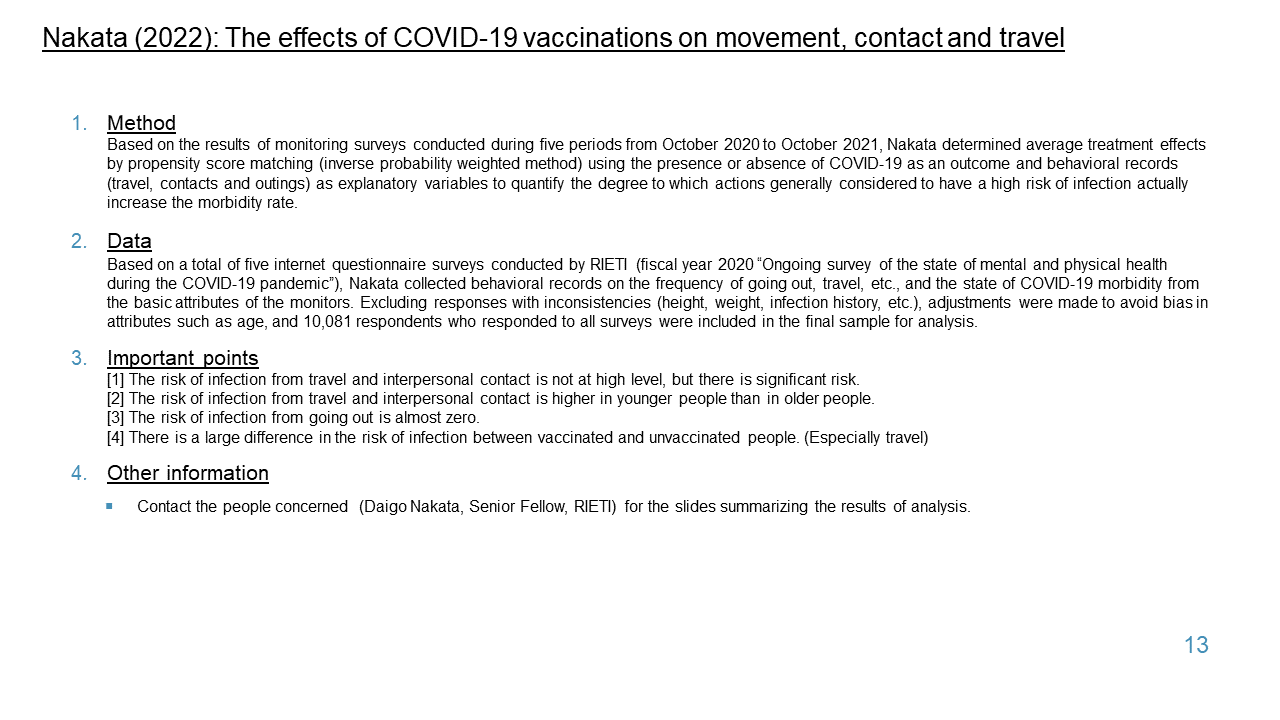
Nakata (2022): The effects of COVID-19 vaccinations on movement, contact and travel
1. Method
Based on the results of monitoring surveys conducted during five periods from October 2020 to October 2021, Nakata determined average treatment effects by propensity score matching (inverse probability weighted method) using the presence or absence of COVID-19 as an outcome and behavioral records (travel, contacts and outings) as explanatory variables to quantify the degree to which actions generally considered to have a high risk of infection actually increase the morbidity rate.
2. Data
Based on a total of five internet questionnaire surveys conducted by RIETI (fiscal year 2020 “Ongoing survey of the state of mental and physical health during the COVID-19 pandemic”), Nakata collected behavioral records on the frequency of going out, travel, etc., and the state of COVID-19 morbidity from the basic attributes of the monitors. Excluding responses with inconsistencies (height, weight, infection history, etc.), adjustments were made to avoid bias in attributes such as age, and 10,081 respondents who responded to all surveys were included in the final sample for analysis.
3. Important points
[1] The risk of infection from travel and interpersonal contact is not at high level, but there is significant risk.
[2] The risk of infection from travel and interpersonal contact is higher in younger people than in older people.
[3] The risk of infection from going out is almost zero.
[4] There is a large difference in the risk of infection between vaccinated and unvaccinated people. (Especially travel)
4. Other information
・Contact the people concerned (Daigo Nakata, Senior Fellow, RIETI) for the slides summarizing the results of analysis.
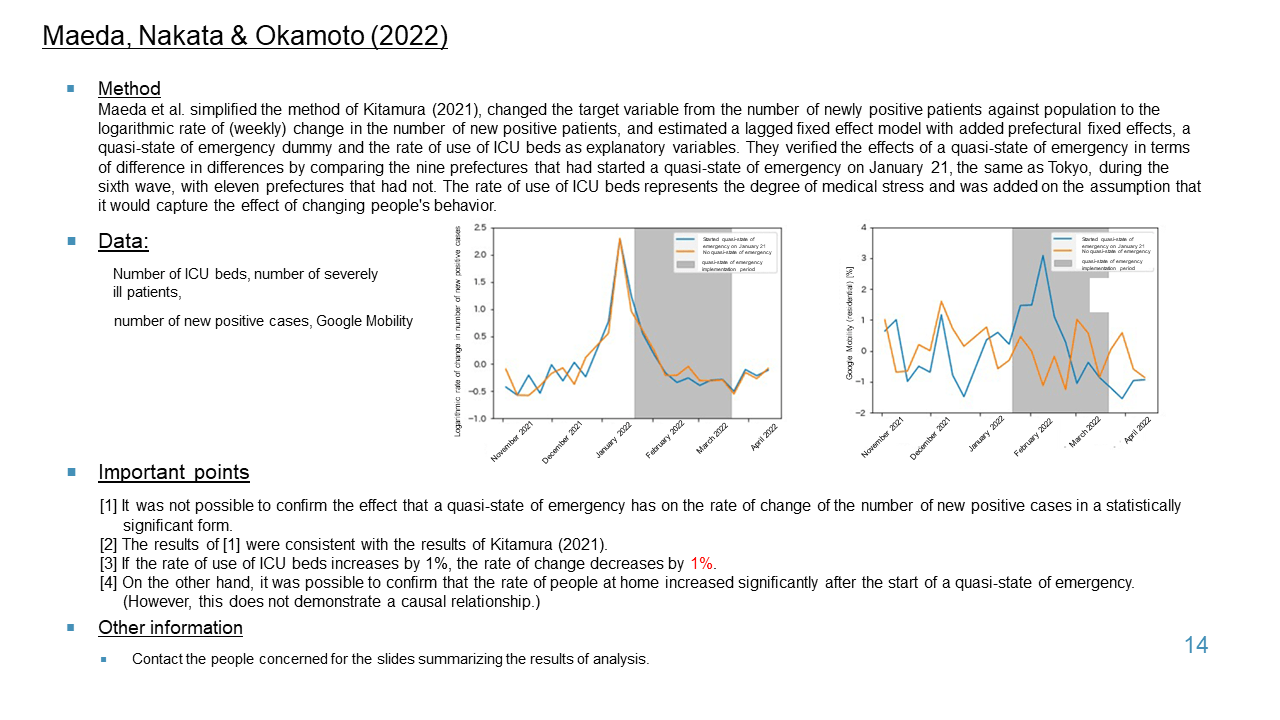
Maeda, Nakata & Okamoto (2022)
1. Method
Maeda et al. simplified the method of Kitamura (2021), changed the target variable from the number of newly positive patients against population to the logarithmic rate of (weekly) change in the number of new positive patients, and estimated a lagged fixed effect model with added prefectural fixed effects, a quasi-state of emergency dummy and the rate of use of ICU beds as explanatory variables. They verified the effects of a quasi-state of emergency in terms of difference in differences by comparing the nine prefectures that had started a quasi-state of emergency on January 21, the same as Tokyo, during the sixth wave, with eleven prefectures that had not. The rate of use of ICU beds represents the degree of medical stress and was added on the assumption that it would capture the effect of changing people's behavior.
2. Data:
Number of ICU beds, number of severely ill patients,
number of new positive cases, Google Mobilityy

3. Important points
[1] It was not possible to confirm the effect that a quasi-state of emergency has on the rate of change of the number of new positive cases in a statistically significant form.
[2] The results of [1] were consistent with the results of Kitamura (2021).
[3] If the rate of use of ICU beds increases by 1%, the rate of change decreases by 1%.
[4] On the other hand, it was possible to confirm that the rate of people at home increased significantly after the start of a quasi-state of emergency. (However, this does not demonstrate a causal relationship.)
4. Other information
・Contact the people concerned for the slides summarizing the results of analysis.
・Taisuke Nakata is supported by JSPS Grant-in-Aid for Scientific Research (KAKENHI), Project Number 22H04927, the Research Institute of Science and Technology for Society at the Japan Science and Technology Agency, COVID-19 AI and Simulation Project (Cabinet Secretariat), the Center for Advanced Research in Finance at the University of Tokyo, and the Tokyo Center for Economic Research.
・Research papers and policy reports
・https://www.bicea.e.u-tokyo.ac.jp/
・https://covid19-icu-tool.herokuapp.com/